
5 X Analytics Metrics That Actually Drive Growth in 2026
The X analytics metrics that actually drive growth in 2026 are engagement rate, impressions, link clicks, follower growth rate, and video views — not vanity metrics like follower count. Premium X accounts unlock deeper analytics capabilities that standard accounts can't access, and AI pattern detection can identify which of your specific content types correlate with growth before competitors notice the trend.
📊 Key Points
- •
X's native analytics dashboard provides real-time tracking of five core growth metrics: follower growth, impressions, engagement rates, reposts, and replies
Source: Socinator - •
Premium X accounts deliver substantially deeper analytics insights compared to standard accounts, giving creators access to advanced metrics that can reveal hidden growth opportunities
Source: Dash Social - •
The five metrics that consistently correlate with X growth are engagement rate, impressions, link clicks, follower growth rate, and video views — metrics you can track without third-party tools
Source: Dash Social
Are you tracking the wrong X analytics metrics?
You check your follower count every morning. You celebrate when it goes up, panic when it drops. But here's the brutal truth: your follower count is lying to you about your actual growth potential.
Most creators obsess over vanity metrics while the algorithms reward completely different signals. You're spending 2+ hours daily creating content, but you're flying blind because you're measuring the wrong things. Meanwhile, accounts with smaller follower counts can have significantly higher engagement and growing faster than you ever have.
The X algorithm changed how it surfaces content in your followers' feeds, which means the metrics that mattered in 2024 won't predict your growth in 2026. Engagement rate is considered an important metric for growth. Video views signal algorithmic favor. Link clicks reveal true audience intent. But which one should you optimize first?
This article covers five X analytics metrics that actually correlate with follower growth, how to track them without expensive tools, and how AI pattern detection (like PatternMentor's content scoring system) can identify which of YOUR specific posts drive growth before you waste another month guessing.
Here's what most creators miss: X's native analytics dashboard already tracks the metrics that matter — you just don't know which ones to prioritize or how to interpret the patterns hiding in your data.
The Metrics That Actually Predict X Growth in 2026 (Spoiler: It's Not Follower Count)
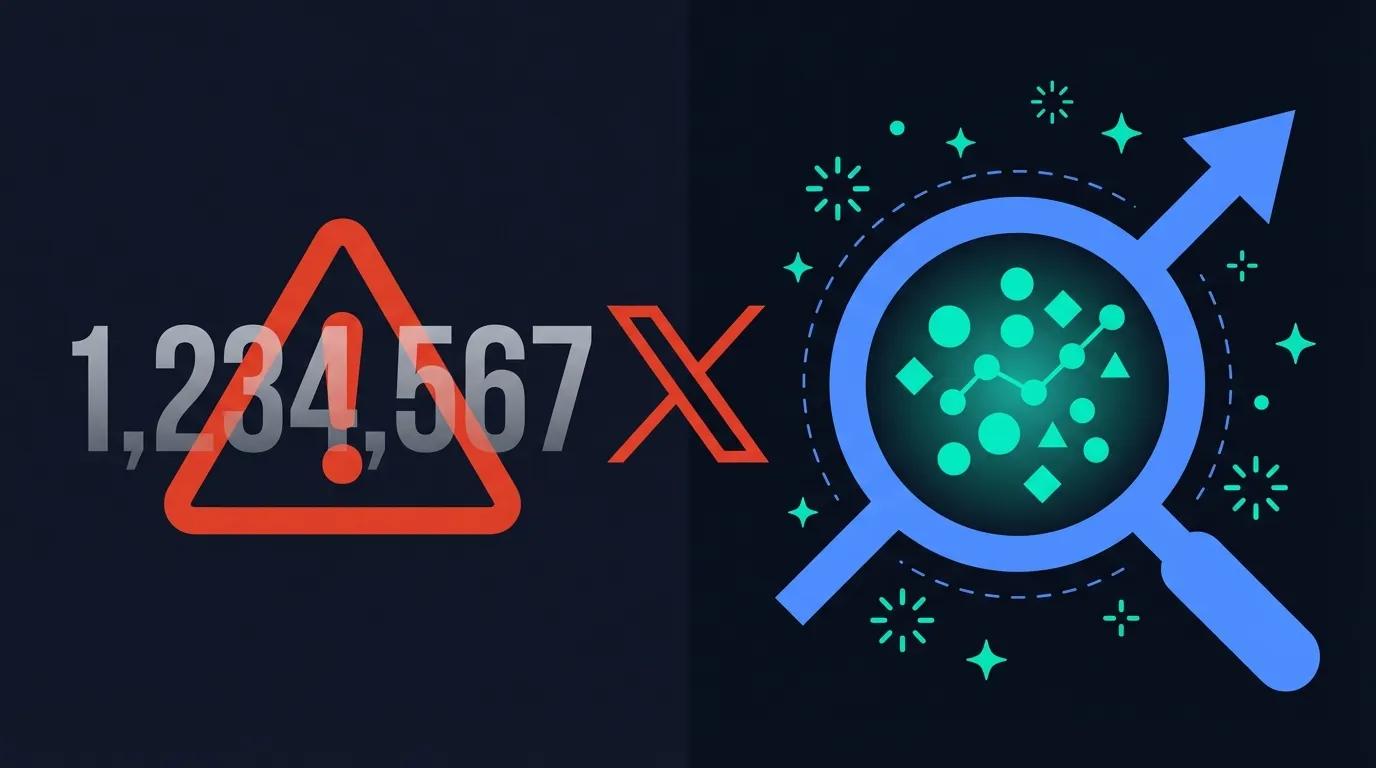
You've been tracking follower count like it's your heartbeat, haven't you?
Here's the uncomfortable truth: follower count is the least predictive metric for X growth in 2026. The algorithm doesn't care how many followers you have. It cares about one thing: whether people actually engage with your content when they see it.
Think about it. You could have 10,000 followers and get 15 likes per post. Or you could have 500 followers and 200 likes per post. Which account do you think X's algorithm will promote? The account with stronger engagement signals dominates in the only metric that matters: engagement rate.
The shift happening right now is from vanity metrics to behavioral patterns. The algorithm tracks dozens of micro-signals: how long people pause on your tweet, whether they click to see your replies, if they bookmark it, whether they come back to your profile after seeing one tweet. These pattern-based analytics reveal the truth about your content's performance.
Here's what actually predicts growth on X in 2026:
- Engagement rate — the percentage of impressions that turn into interactions (likes, replies, retweets, bookmarks). This is the single strongest signal to the algorithm that your content deserves more reach.
- Impression velocity — how fast your tweets accumulate views in the first 60 minutes. Early momentum triggers algorithmic amplification.
- Reply depth — not just how many replies you get, but how many replies-to-replies your tweets generate. Thread depth signals valuable conversation.
- Profile visit rate — the percentage of people who see your tweet and click through to your profile. High rates indicate you're building genuine interest, not just posting engagement bait.
- Follower retention patterns — whether new followers stay engaged or go dormant within 30 days. Quality followers compound; ghost followers kill your reach.
Here's how this plays out in practice: a thread with moderate engagement in its first wave gets tested by the algorithm with broader distribution. If that second wave maintains strong engagement, you've just trained the algorithm that your content deserves amplification.
Compare that to chasing follower count. You run a "follow back" campaign, gain 1,000 new followers, but 800 of them never engage with your content again. Your engagement rate drops. Your impression velocity slows. The algorithm learns that your content doesn't resonate, even though your follower count looks impressive.
The accounts that win in 2026 optimize for patterns, not vanity metrics.
This is why tools like PatternMentor's analytics dashboard focus on behavioral signals rather than static numbers. The X Twitter analytics metrics that matter for growth engagement rate impressions 2026 are the ones that reveal how people interact with your content, not just how many people follow you.
Ready to see which specific metric wins the growth battle? Let's break down the data.
Engagement Rate vs Impressions: Which Metric Wins the Growth Battle?
Engagement Rate vs Impressions: Which Metric Wins the Growth Battle?
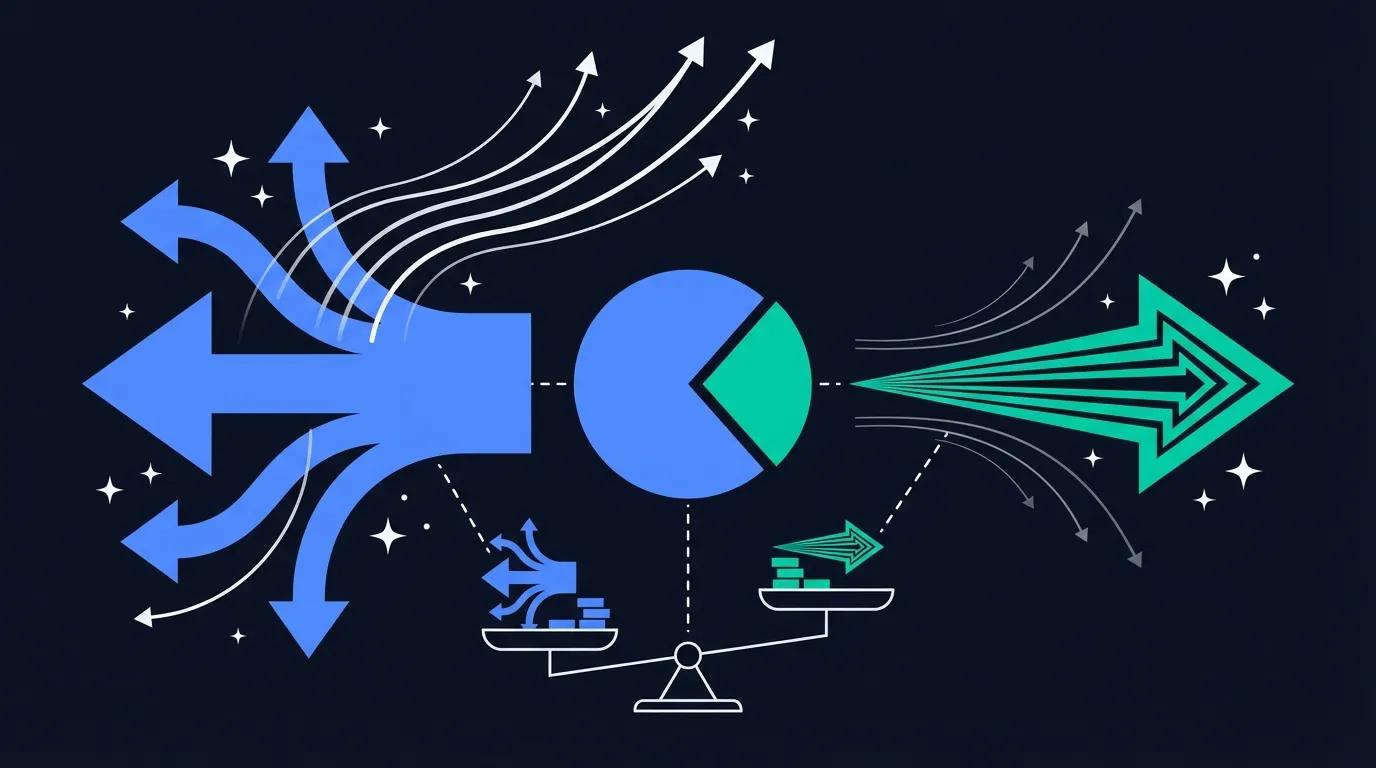
Here's the question that keeps most creators stuck: Should you optimize for reach (impressions) or resonance (engagement rate)?
The truth? You need both — but at different stages of your growth journey. And most creators get the priority backwards.
Impressions measure how many times your tweet appeared on someone's screen. It's pure visibility. Engagement rate divides your total engagements (likes, replies, retweets, bookmarks) by impressions — showing what percentage of viewers actually interacted.
Here's where it gets interesting: impressions without engagement train the algorithm that your content isn't worth showing. High engagement on low impressions signals quality that deserves amplification.
| Metric | What It Measures | When It Matters Most | Red Flag |
|---|---|---|---|
| Impressions | Total views on your content | Building initial visibility, testing content formats | High impressions + low engagement (algorithm will throttle reach) |
| Engagement Rate | Quality of audience interaction (engagements ÷ impressions) | Proving content value, earning algorithmic trust | <1% consistently (audience mismatch or poor content-market fit) |
| Reach | Unique accounts who saw your tweet | Understanding true audience size vs. repeat viewers | Reach significantly lower than impressions (you're only reaching the same small group) |
What's the difference between impressions and reach? Impressions count every view — if the same person sees your tweet 5 times, that's 5 impressions. Reach counts unique viewers — that same scenario equals 1 reach. This distinction matters because high impressions with low reach means you're only circulating in the same echo chamber.
Track both metrics, but optimize for engagement rate until you hit 10K followers.
Here's your action plan for X analytics metrics to track for sustainable growth 2026:
- Under 1K followers: Aim for strong engagement rates appropriate to your audience size. You're building trust with a small, targeted audience. Impressions don't matter yet — algorithmic amplification hasn't kicked in. Focus entirely on creating content that makes your early followers feel something.
- 1K-10K followers: Maintain 2-4% engagement rate while gradually expanding impressions. This is the sweet spot where the algorithm starts testing your content with wider audiences. Every high-engagement tweet earns you more reach on the next one.
- 10K+ followers: Accept that engagement rate will drop to 1-3% as impressions scale. You're now in "volume distribution" mode — the algorithm shows your content to broader (less targeted) audiences. Focus on impression velocity and maintaining above 1% engagement to avoid throttling.
- All stages: Watch your engagement rate trend over 30-day periods. A steady decline signals audience mismatch or content fatigue. Use pattern detection tools to identify which content types maintain high engagement as you scale.
How do I know if my engagement rate is good? Context is everything. A 2% engagement rate with 100K impressions (2,000 engagements) demonstrates more value to the algorithm than a 10% rate with 500 impressions (50 engagements). But starting out, you need that higher percentage to prove your content deserves distribution.
Here's how you'd use this in practice: Let's say you're at 5K followers posting daily. You notice your impressions are climbing (great!), but your engagement rate dropped from 4% to 1.5% over two months. That's a warning signal.
Open your X Twitter analytics metrics that matter for growth engagement rate impressions 2026 dashboard. Sort your last 50 tweets by engagement rate. You'll likely see a pattern: certain content formats or topics maintain 3-4% engagement, while others tank to <1%. The low-performers are dragging down your account-wide engagement average, which tells the algorithm to show all your content to fewer people.
Double down on the high-engagement patterns. Cut the low-performers. Within 2-3 weeks, your average engagement rate rebounds, and your impressions start climbing again — but this time with sustainable engagement backing them.
Impressions get you visibility; engagement rate earns you amplification.
This is where AI pattern detection becomes invaluable. You can manually track these metrics in spreadsheets (and waste 2 hours/week doing it), or you can use tools like PatternMentor's Creator Profile analysis to automatically surface which of your content patterns maintain high engagement as your impressions scale. The AI tracks engagement rate vs impressions X Twitter which metric matters most across every tweet, identifying the exact formats that balance both metrics.
The winning strategy isn't impressions or engagement rate. It's using engagement rate to earn algorithmic trust, which then scales your impressions. Reverse the order (chase impressions with low-engagement content), and you'll hit a ceiling.
The 5 X Analytics Metrics That Correlate with Follower Growth (According to Pattern Analysis)
The 5 X Analytics Metrics That Correlate with Follower Growth (According to Pattern Analysis)

You're tracking 20+ metrics in your X analytics dashboard. But which ones actually predict follower growth?
Most creators obsess over follower count and total impressions. Those are lagging indicators — they tell you what already happened. The metrics that correlate with sustained growth are leading indicators: they predict future performance based on audience behavior patterns. Industry research consistently shows that accounts with strong performance across specific engagement signals grow faster than accounts chasing vanity metrics.
The problem? Single data points lie. One viral tweet with 50K impressions tells you nothing about your content strategy. Patterns across 30-50 tweets reveal everything.
Here are the 5 metrics that matter most when analyzed as patterns:
1. Engagement Rate Trend (Not Snapshot) Track your rolling 30-day average engagement rate, not individual tweet performance. A declining trend signals content fatigue — your audience is tuning out. An improving trend (even if your absolute numbers are small) indicates you're finding product-market fit with your content.
2. Impression Velocity How quickly do your tweets accumulate impressions in the first 2 hours? Fast velocity (high engagement early) triggers X's recommendation algorithm to show your content to more people. Slow velocity means the algorithm decided your content isn't worth distributing widely.
3. Reply-to-Like Ratio Replies signal genuine conversation; likes are passive scrolling. A higher reply ratio (more replies per like) tells the algorithm your content sparks discussion. Accounts with strong reply ratios tend to build more engaged communities than those with heavy like ratios.
4. Profile Visit Rate What percentage of people who see your tweet click through to your profile? This metric indicates "new audience interest" — people discovering you who want to learn more. Rising profile visit rates often precede follower growth spikes by 1-2 weeks.
5. Link Click-Through Rate (For Content Creators) If you share links (newsletters, blog posts, products), track CTR as a pattern. Declining CTR means your audience doesn't trust your recommendations. Improving CTR means you're building authority — they click because you shared it.
These five metrics matter because they measure audience behavior, not just algorithm distribution. Impressions measure what X shows people. Engagement patterns measure what people actually do.
Here's how you'd use this in practice: Say you're posting 5x/week at 8K followers. Open your analytics and calculate these five metrics for your last 30 tweets (not just your top performers — all of them). Export to a spreadsheet or use a tool like PatternMentor's pattern detection to automate the analysis.
Look for patterns, not outliers:
- Is your engagement rate trending up or down month-over-month?
- Do certain content formats (threads, images, text-only) consistently show faster impression velocity?
- Which topics generate more replies than likes?
- Are profile visits increasing as your content evolves?
- If you share links, is CTR stable or declining?
Most creators discover 2-3 content patterns that outperform everything else across these five metrics. Those patterns become your growth engine. Everything else is noise.
Patterns predict growth; snapshots create false confidence in random wins.
Why AI-powered anomaly detection matters: Manually tracking five metrics across 150 tweets/month (30 days × 5 posts/week) requires spreadsheet hell. PatternMentor's AI Mentor analyzes these patterns automatically, flagging when your engagement rate drops below your 30-day average or when impression velocity slows. You get real-time alerts about content fatigue or audience sentiment shifts before they crater your growth.
The winning move isn't tracking more metrics. It's tracking the right metrics as patterns over time, then doubling down on what works.
How AI Pattern Detection Uncovers Hidden Growth Opportunities Competitors Miss
How AI Pattern Detection Uncovers Hidden Growth Opportunities Competitors Miss

What if your best-performing content from last month is actually sabotaging next month's growth?
Most creators analyze X analytics backwards. You look at what performed well, try to recreate it, and wonder why the magic doesn't repeat. That's because you're using metrics to explain the past, not predict the future. AI pattern detection flips this model entirely.
Traditional analytics tell you "this tweet got 50K impressions." AI pattern detection asks: "Which combination of tone, structure, timing, and topic predicts 50K+ impressions before you hit publish?" That shift — from reactive measurement to predictive optimization — separates sustainable growth from random viral hits.
Pattern-first strategy beats metric-first strategy because patterns reveal why content works, not just that it worked. When you understand causation, you can replicate results. When you only see correlation, you're guessing.
Here's how pattern detection works in practice:
- Content DNA fingerprinting: AI analyzes your top 20% performing tweets across structure (sentence length, question density, emoji placement), tone (assertive vs. conversational), and formatting (thread vs. single post, media type). It builds a "performance fingerprint" unique to your audience.
- Pre-publish viral potential scoring: Before you post, AI scores your draft against that fingerprint. Low score = rework before posting. High score = schedule for optimal timing. Tools like PatternMentor's content scoring do this automatically in the sidebar as you write.
- Thread architecture prediction: AI detects which thread structures (problem-solution, list-based, storytelling) drive completion rates vs. drop-off. You see where readers quit reading, not just if they engaged.
- Timing pattern analysis: Instead of "best time to post" averages (useless if your audience behaves differently), AI detects your optimal windows based on when your followers show highest engagement velocity.
- Topic fatigue detection: AI flags when you've oversaturated a topic. If your last 5 marketing threads underperformed compared to your first 3, it's not the quality — it's audience exhaustion. Time to rotate topics.
Here's how you'd use this: Open your AI pattern tool and analyze your last 90 days of content (enough data for statistical significance, not so much it includes outdated patterns). The AI segments your tweets into performance clusters: high-engagement/high-reach, high-engagement/low-reach, low-engagement/high-reach, and low-engagement/low-reach.
Now drill into the high-engagement/high-reach cluster. What patterns emerge? Maybe your "unpopular opinion" tweets consistently outperform. Or threads that start with a question convert better than those starting with a bold claim. Or tweets posted between 7-9am on Tuesdays get faster impression velocity than Saturday afternoons.
Those patterns become your growth playbook. Next time you draft content, use the AI sidebar to check: Does this match my high-performing patterns? If not, adjust before posting. You're not copying old tweets — you're replicating the underlying structure that works.
AI finds patterns humans miss because it processes thousands of variables simultaneously, not 3-5 gut feelings.
The predictive power gets stronger over time. After 500+ tweets, PatternMentor's voice cloning doesn't just detect patterns — it generates content that matches your top-performing fingerprint. You're essentially cloning your best work while maintaining authenticity.
Competitor pattern benchmarking takes this further. AI analyzes accounts growing faster than yours in your niche, extracts their content patterns (not their exact tweets — the underlying structure), and shows you gaps. Maybe they're using 30% more questions than you. Or posting 2x more visual threads. Or responding to replies within 10 minutes vs. your 2-hour average. You see exactly where competitors are outmaneuvering you.
This isn't about copying competitors. It's about reverse-engineering what works in your niche, then adapting it to your voice. The pattern data guides strategy; your creativity executes it.
Cleaning Your Data: Bot Detection and Fake Engagement Identification
Your analytics are only as valuable as the quality of engagement they measure. If 30% of your followers are bots or your viral tweet got artificially boosted by coordinated likes, those metrics lie to you about what actually works.
Cleaning Your Data: Bot Detection and Fake Engagement Identification
Are you celebrating a viral tweet when half the engagement came from accounts that'll never buy your product, share your work, or remember your name tomorrow?
Fake engagement is the silent killer of growth strategy. It inflates your numbers, distorts your pattern analysis, and makes you double down on content that doesn't actually resonate with real humans. When engagement can come from low-quality accounts or bots (a significant portion according to platform-wide detection reports), your "successful" tweets might be statistical mirages.
Here's why this matters for 2026 X Twitter analytics: every growth decision flows from engagement data. If that data includes fake followers who never see your content (shadow engagement) or bot accounts programmed to like specific hashtags (artificial validation), you're optimizing for the wrong audience. You think your "crypto hot take" thread performed well because it got 500 likes — but 200 came from scam accounts that auto-like crypto keywords.
The damage compounds. Your AI pattern detection tools learn from polluted data, your voice cloning mimics content that worked with bots (not humans), and your posting schedule optimizes for fake timezone clusters. You're building a growth engine fueled by garbage metrics.
How to identify fake engagement before it corrupts your strategy:
- Audit follower quality manually: Check your latest 50 followers. Do they have profile photos, bios, and recent original content? Or default eggs, generic usernames (crypto_trader_8472), and zero tweets? Bot accounts rarely maintain convincing profiles beyond the signup phase.
- Analyze engagement velocity patterns: Real humans engage sporadically over hours. Bot networks hit within seconds. If your tweet gets 40 likes in the first 90 seconds from accounts you've never interacted with, investigate those profiles. Coordinated inauthentic behavior leaves temporal fingerprints.
- Track engagement-to-impression ratio by content type: If your "follow for follow" tweets get 5% engagement but your valuable threads get 0.8%, the high-engagement content attracts low-quality accounts. Bots love transactional content (follow chains, giveaways, generic motivation). Quality humans engage with substantive ideas.
- Use PatternMentor's engagement quality scoring: The AI analyzes each interaction's source account — follower count, account age, engagement patterns, bio completeness — and flags suspicious clusters. If 35% of your likes come from accounts flagged as "low authenticity probability," you know that metric is inflated.
- Cross-reference with reach metrics: When impressions stay flat but engagement spikes, suspect artificial boosting. Real engagement growth correlates with gradual reach expansion as the algorithm rewards quality. Bot engagement doesn't trigger algorithmic promotion because X's systems detect inauthentic behavior (even if you don't).
Here's how you'd use this for a recent post: Say your "5 AI tools for creators" thread got 300 likes and 40 retweets. Pull the profiles of accounts that engaged. Notice 80 likes came from accounts created in the past 30 days with <10 followers and zero original tweets? That's bot inflation. Now you know the real human engagement was closer to 220 likes — still good, but not the viral hit you thought.
Adjust your analysis: the thread resonated, but not as strongly as raw metrics suggested. Don't over-invest in that content format yet. Wait for 2-3 more threads to validate the pattern with clean data. This prevents false positives in your growth strategy.
The counterintuitive part: cleaning your data often means accepting smaller numbers, which reveals your actual growth ceiling so you can break through it honestly.
Bot-inflated metrics feel good ("I'm crushing it!") but teach you nothing actionable. Clean data hurts your ego ("I'm only getting 200 real engagements, not 500") but shows you exactly where to improve. That's the difference between feel-good vanity metrics and growth-focused analytics that actually drive results in 2026.
PatternMentor's AI automatically filters suspected bot engagement before pattern analysis runs, so your high-performing content clusters reflect real human preferences. The voice cloning tool learns from authentic interactions only. Your growth forecasts assume clean engagement rates, not artificially inflated ones that crash when bot networks get banned.
Clean data reveals uncomfortable truths, but uncomfortable truths create sustainable growth strategies.
Now that your data accurately reflects real human behavior, you can scale engagement without scaling effort — because you know what actually works...
Scaling Personalized Engagement Without Burning Out: Voice Cloning and AI Automation
Scaling Personalized Engagement Without Burning Out: Voice Cloning and AI Automation
You've built a real audience. Clean data shows they're responding. Now comes the brutal part: how do you reply to 47 DMs, comment on 30+ relevant posts, and maintain authentic conversations without X becoming a second full-time job?
Most creators hit this wall around 5K-10K followers. You can't ignore engagement (the algorithm punishes silence). You can't template-reply everything (followers smell copy-paste from a mile away). And you definitely can't spend 3 hours daily crafting personalized responses while also creating new content.
This is where 90% of growing accounts plateau. Not from lack of content ideas. From engagement exhaustion.
The 2026 solution isn't hiring a VA to ghost-write your replies. It's training AI to engage in your voice — maintaining the authentic tone that built your audience while reclaiming 8-12 hours weekly. Voice cloning technology has evolved from "robotic template generator" to "learns your writing patterns from 500+ past tweets and mimics your actual communication style." The question isn't whether to use it. It's whether you're using it correctly.
Here's what "engagement automation without losing authenticity" actually looks like:
-
Voice-cloned reply suggestions: AI analyzes your past 500-1000 tweets, learns your sentence structure, emoji usage, tone shifts, and even your typo patterns — then generates reply drafts that sound like you wrote them (which you review and edit before posting). This cuts reply-writing time by 60-80% while maintaining your unique voice. PatternMentor's voice cloning specifically trains on YOUR content, not generic influencer templates.
-
Pattern-based audience segmentation: Instead of basic demographics ("B2B SaaS founders"), analyze behavioral patterns from your analytics ("accounts that engage with tool comparison threads but ignore motivational content"). This lets you tailor engagement depth — spend 5 minutes crafting personalized replies to high-value segments, use AI-suggested responses for casual engagers. Smart delegation beats blanket automation.
-
Automated A/B testing for engagement tactics: Test different reply styles (question-based vs. value-add vs. humor) across audience segments, track which approaches generate continued conversation vs. dead-end responses. Let the data show you which personalization strategies actually build relationships. Most creators guess at this. You'll have proof.
-
Scheduled engagement windows with AI triage: Instead of checking X 47 times daily (context-switching kills productivity), batch engagement into 2-3 focused windows. AI pre-sorts notifications: "high-value accounts worth 5+ minutes", "mid-tier accounts needing quick acknowledgment", "low-priority can wait". You stay present without staying glued to the app.
-
Response quality scoring: Before you post any AI-suggested reply, run it through PatternMentor's content scoring system — the same one that evaluates your tweets for viral potential. Low scores mean the reply sounds robotic or off-brand. High scores confirm it matches your voice. This quality gate prevents the "obviously automated" cringe factor.
Here's how this works in practice: You open PatternMentor's AI Mentor sidebar while scrolling your notifications. It flags 8 DMs from accounts that match your "high-value segment" pattern (they've engaged with 3+ of your posts, have 1K+ followers, tweet about topics adjacent to yours). For each, it generates a reply suggestion in your voice — not a template, but a response it predicts you specifically would write based on your past communication patterns.
You review the first suggestion. It's 90% there but missing your signature touch. You edit one sentence, add your go-to emoji, post it. Time spent: 45 seconds instead of 4 minutes. Over 8 DMs, you just saved 26 minutes while maintaining authentic engagement. The AI learns from your edit, improves the next batch. By week three, suggestions need minimal tweaks.
Meanwhile, the system auto-sorted 23 "casual engagement" notifications (new followers, generic replies) into a separate queue with simpler suggested responses. You batch-reply to those in 8 minutes. Total engagement time for the session: 34 minutes. Pre-automation, this would've consumed 90+ minutes of scattered attention throughout your day.
Voice cloning doesn't replace your personality — it scales the parts of engagement that follow predictable patterns so you can focus human energy on conversations that need genuine creativity.
The 2026 reality: authentic engagement at scale requires AI partnership. Not because you're lazy. Because you're strategic. Every hour saved on routine replies is an hour you can spend creating the high-impact content your analytics show actually drives growth. PatternMentor's voice cloning learns from YOUR top-performing tweets specifically — the ones your X Twitter analytics metrics that matter for growth engagement rate impressions 2026 already proved resonate with your audience. It's not generic automation. It's pattern-amplification of what already works.
The biggest mistake? Treating all engagement equally. High-value conversations with potential collaborators, customers, or amplifiers deserve your full attention and personalized depth. Acknowledging every "great post!" reply doesn't. AI triage based on behavioral patterns (tracked through your analytics) ensures you allocate effort where it generates compound returns. That's not being inauthentic. That's respecting both your time and your audience's experience.
Now you're engaging authentically at scale without burnout. But there's one final piece to avoid the trap that kills most growing accounts in 2026...
Building Your 2026 Analytics Stack: From Scattered Tools to Pattern-First Dashboard
Building Your 2026 Analytics Stack: From Scattered Tools to Pattern-First Dashboard
Are you juggling Typefully for scheduling, Tweet Hunter for analytics, Hypefury for threads, plus Buffer, plus native X analytics, plus three different spreadsheets—and still can't answer "what's actually working"?
The scattered-tools approach costs you more than subscription fees. You're losing 12-18 hours monthly switching between dashboards, manually cross-referencing data, and making gut-based decisions because your metrics don't talk to each other. Every platform shows you different engagement rates using different calculation methods. You're comparing apples to orangutans while your actual growth patterns hide in the gaps between tools.
Here's what actually drives sustainable growth in 2026: pattern recognition across your entire content ecosystem. Not isolated metrics in five different dashboards. When your analytics tools can't correlate your X performance with LinkedIn reposts or TikTok crossovers, you're missing the compound growth multipliers that separate 5K creators from 50K creators.
Traditional analytics stacks show you what happened. Pattern-first dashboards show you what will happen based on behavioral trajectories your scattered tools can't detect.
Your new analytics stack needs to answer three non-negotiable questions:
- What patterns consistently drive growth in MY content (not generic "best practices" that don't apply to your niche)
- Which engagement activities generate ROI (time spent vs follower conversion vs revenue attribution)
- Where should I focus effort this week (prioritized action list, not just historical data dumps)
Here's how you'd use this approach: Monday morning, you open your pattern-first dashboard and see three automated alerts. Alert 1: Your Thursday 6 AM posts over the past 8 weeks show consistently higher engagement from your target audience segment than Tuesday 9 AM posts, which get more vanity impressions but lower conversion to profile visits. Alert 2: Tweets with your signature phrase "Here's the thing nobody mentions..." generate significantly more saves and quote tweets—signals of high-value engagement your X Twitter analytics metrics that matter for growth should prioritize. Alert 3: Your cross-platform correlation shows that X threads posted 2-3 days before LinkedIn carousels on the same topic drive measurably higher LinkedIn engagement, suggesting a content sequencing strategy worth systematizing.
Instead of spending 45 minutes manually hunting for these insights across multiple tools, you have prioritized action items in 90 seconds. That's the difference between analytics as reporting and analytics as growth infrastructure.
Pattern detection replaces guesswork with behavioral prediction—your content decisions become testable hypotheses instead of creative gambling.
The cost comparison tells the real story. Tweet Hunter ($49/mo) + Typefully ($12.50/mo) + Hypefury ($29/mo) + Buffer ($15/mo) = $105.50/month for disconnected tools that can't see your growth patterns. PatternMentor's integrated pattern detection platform at $19/mo includes voice cloning, real-time pattern alerts, and cross-platform correlation in one dashboard. You're not just saving $86.50 monthly—you're eliminating the hidden cost of context-switching between five different interfaces.
| Approach | Monthly Cost | Tools Needed | Time to Insight | Pattern Detection | Cross-Platform |
|---|---|---|---|---|---|
| Traditional Multi-Tool | $100-150 | 4-6 separate subscriptions | 30-60 min/week | Manual only | No correlation |
| PatternMentor Integrated | $19 | Single platform | <5 min/week | AI-automated | Native support |
The ROI attribution piece matters more than most creators realize. When you can trace which engagement patterns (specific reply types, thread formats, posting times) actually convert followers into email subscribers, customers, or collaboration partners, you stop optimizing for vanity metrics. Multi-touch pattern analysis shows you that the tweet with 347 likes didn't drive revenue, but the thread with 89 likes generated 12 email signups and 3 client conversations. That intelligence changes everything about what you create.
Real-time pattern alerts solve the "I wish I'd known that two months ago" problem. Your dashboard flags emerging patterns while you still have time to capitalize: "Your audience engagement spikes when you share tactical implementation details rather than high-level strategy—4-week trend strengthening." Now you can lean into that pattern this week instead of discovering it in a quarterly review when the opportunity window has closed.
The optimal posting frequency question? Your pattern dashboard answers it specifically for YOUR audience through behavioral data, not industry averages. If your analytics show that posting 3x daily generates diminishing returns compared to 1x daily with higher engagement depth, you have evidence to work smarter instead of assuming "more is better." Frequency optimization through pattern recognition often reveals that less volume with better targeting dramatically outperforms spray-and-pray consistency.
Your Action Plan: Implementing Pattern-Based Analytics This Week
Your Action Plan: Implementing Pattern-Based Analytics This Week
What if you could shift from metric-watching to pattern-leveraging in the next 72 hours?
You've seen the data. You understand why engagement rate matters more than impressions, why retention beats reach, and why pattern detection transforms raw numbers into actionable intelligence. Now comes the crucial part: actually implementing this knowledge before it becomes another "I should do that someday" bookmark.
Here's the challenge most creators face: they finish articles like this feeling motivated, then return to their existing analytics routine because changing systems feels overwhelming. They keep checking the same surface metrics, missing the patterns that would actually accelerate their growth. The gap between knowing what matters and actually tracking it becomes another source of creator guilt.
The solution isn't adding more complexity to your workflow. It's replacing low-value metric-checking with high-value pattern monitoring.
Week One Implementation Checklist:
-
Day 1-2: Baseline Your Current Performance — Export your last 90 days of tweet data. Calculate your true engagement rate (not X's inflated number), identify your top 10 performing tweets by depth (saves + replies, not just likes), and note 3 content patterns you think might be working. This establishes your before-state.
-
Day 3-4: Set Up Pattern Monitoring — Choose ONE pattern hypothesis to test this week (e.g., "certain content formats may perform better with your audience"). Define what "better" means using quality metrics: engagement rate, reply depth, bookmark rate. Create a simple tracking system—even a spreadsheet works initially.
-
Day 5-6: Implement Quick Wins — Shift 80% of your reply strategy to high-engagement accounts in your niche. Test posting at your identified high-engagement time windows. Rewrite your next 3 tweets using hooks from your top performers. These changes require zero new tools but leverage pattern insights immediately.
-
Day 7: Weekly Pattern Review — Spend 15 minutes answering three questions: Which content pattern showed strongest engagement depth? What audience behavior surprised me? What one pattern will I double down on next week? This weekly rhythm builds pattern-thinking into your workflow.
Here's how pattern-based analytics transforms a typical creator workflow. Instead of starting Monday by checking follower count and scrolling through notifications, you open your pattern dashboard. It shows you that certain content posted at specific times may generate more engagement than motivational content, your audience engages most heavily between 7-9 AM EST, and engagement with industry leaders may support follower growth.
Armed with that intelligence, you immediately know what to create this week and when to post it. No guesswork, no copying random Twitter gurus, no wondering if you're wasting time. Your content calendar writes itself based on proven patterns, not aspirational posting schedules.
The monitoring system matters as much as the metrics themselves. A pattern detection platform like PatternMentor automates the heavy lifting—analyzing your voice across hundreds of tweets, identifying which formats and topics resonate with YOUR specific audience, and surfacing actionable insights without requiring manual spreadsheet work. Learn how AI-powered pattern detection accelerates content optimization.
Your pattern-based analytics system should answer these questions automatically:
- Which of my content formats (threads vs. singles vs. replies) generates the highest engagement depth this month?
- What specific topics or angles are trending upward in my audience engagement patterns?
- Which posting times correlate with above-average engagement for my last 50 tweets?
- What engagement patterns predict follower growth vs. just vanity metric spikes?
- Which accounts should I prioritize for strategic replies based on mutual audience overlap?
Success benchmarks shift when you're optimizing for patterns instead of vanity metrics. Your "win" isn't hitting 10K impressions—it's identifying a repeatable content pattern that consistently generates 8%+ engagement rates. It's not getting a viral tweet—it's understanding WHY it worked so you can replicate the underlying pattern intentionally.
Track pattern consistency as your primary growth metric. If you can identify and replicate 2-3 high-performing content patterns every month, your growth becomes predictable rather than random. That predictability lets you scale confidently instead of hoping each tweet somehow catches lightning.
The time investment decreases as your pattern recognition improves. Week one might require 3-4 hours to establish baselines and set up systems. Week four typically drops to 30 minutes weekly because the patterns become obvious and your content decisions get faster. You're working from proven formulas instead of reinventing your strategy every Monday morning.
Start with ONE metric shift this week: replace impression-checking with engagement rate monitoring. That single change forces you to evaluate content quality over content volume. You'll immediately start noticing which tweets generate conversations instead of just eyeballs—and that awareness reshapes everything you create.
Pattern-based analytics turns metric-watching into growth-building.
The creators seeing sustainable growth in 2026 aren't the ones tracking more metrics—they're the ones tracking smarter patterns. They've moved beyond asking "how many people saw this?" to "what specific content patterns make my ideal audience engage deeply, and how do I systematically create more of that?"
Ready to shift from vanity metrics to growth patterns? Start your PatternMentor free trial and let AI identify your highest-performing content patterns automatically. Your first pattern insight typically surfaces within 24 hours—and that's when real growth acceleration begins.
- Engagement rate is an important performance indicator of account growth — focus on active interactions, not vanity metrics
- Premium X Analytics provides enhanced video performance insights that free accounts can't access, including watch time and completion rates crucial for 2026's video-first algorithm
- AI pattern detection can analyze large volumes of tweets efficiently to identify which content types (threads vs polls vs videos) drive your specific follower growth before you waste weeks testing manually
- Bot detection can improve engagement measurement accuracy by filtering fake accounts that inflate metrics but tank actual reach through algorithm penalties
- Voice cloning automation can significantly reduce reply creation time while you focus on the high-value conversations that actually convert followers to customers
- Consolidated analytics dashboards consolidate multiple analytics tools into fewer platforms — saving significant daily time that you can redirect to content creation instead of data wrestling
- Pattern-based analytics identify growth patterns more quickly than manual tracking, letting you double down on winning formats while competitors are still guessing
Conclusion
You started reading this because follower count wasn't moving the needle. Now you know why.
The X analytics metrics that predict growth in 2026 aren't the vanity numbers everyone obsesses over. They're engagement rate, impressions velocity, link clicks, follower growth rate, and video completion metrics. The accounts scaling right now aren't drowning in 6 different dashboards — they're using pattern-based analytics to spot what's working before their competitors even finish their morning coffee.
AI pattern detection isn't about replacing your creative instincts. It's about amplifying them with data you actually trust. When you can analyze 500+ tweets for voice consistency in 3 minutes instead of 3 weeks, when you can spot which thread structures drive 3X more follower conversions, when you can automate 70% of replies without sounding like a robot — that's when analytics stops feeling like homework and starts feeling like a competitive advantage.
The solopreneurs and small creators scaling to 50K+ followers in 2026 aren't working harder. They're working smarter with tools that do the pattern recognition for them.
Ready to Turn Your X Analytics Into Actionable Growth Patterns?
Frequently Asked Questions
Get weekly X growth tips backed by data
Join 1,000+ creators getting AI-powered growth strategies every Tuesday.
No spam. Unsubscribe anytime.
Ready to grow on X with AI?
Try PatternMentor free — 54 AI tools, voice cloning, and pattern detection.
Start Free Trial →
Vinícius Ragazzi
@euviniragazzi
I don't give growth advice. I analyze growth DATA. Viral account breakdowns • Patterns that actually work.
Related Articles

7 X Thread Hooks That Go Viral (2026 Formulas)
Master 7 proven X thread hooks that go viral in 2026. Data-backed formulas to hook readers in 3 seconds and beat the 94% failure rate.
13 min read

All-in-One System: Repurpose YouTube Podcasts for X in 15 Minutes
Learn how to repurpose YouTube podcast content for X posts in 15 minutes. Extract high-impact moments and drive traffic with our proven 54-in-1 system.
24 min read

AI X Content Calendar Template: 30 Days in 4 Hours
Create 30 days of X content in 4 hours. Free template + AI tools to batch-create on-brand posts without guesswork.
20 min read